
Technology
Technology built around evidence, confidence and human oversight.
A technical-diligence view of how the product is structured, what exists today, and what each next step depends on.
Release scope
What this release demonstrates
This release demonstrates a complete operator investigation workflow using synthetic data and saved observations. Site-specific validation and industrial integration are separate steps.
- Available now
- The invite-gated demonstration covers synthetic scenarios, saved and manually entered observations, data-quality checks, rule-based risk screening, operator reviews, evidence answers and reports.
- Experimental
- The forecast model is trained on synthetic data. Model attribution, residual demonstration bands and simulated what-if and control experiments illustrate how the workflow works.
- Before plant deployment
- Review the process and authorized plant data, map measurement points, units and timestamps, define the forecast target and validation plan, and scope read-only integration separately.
A · Architecture
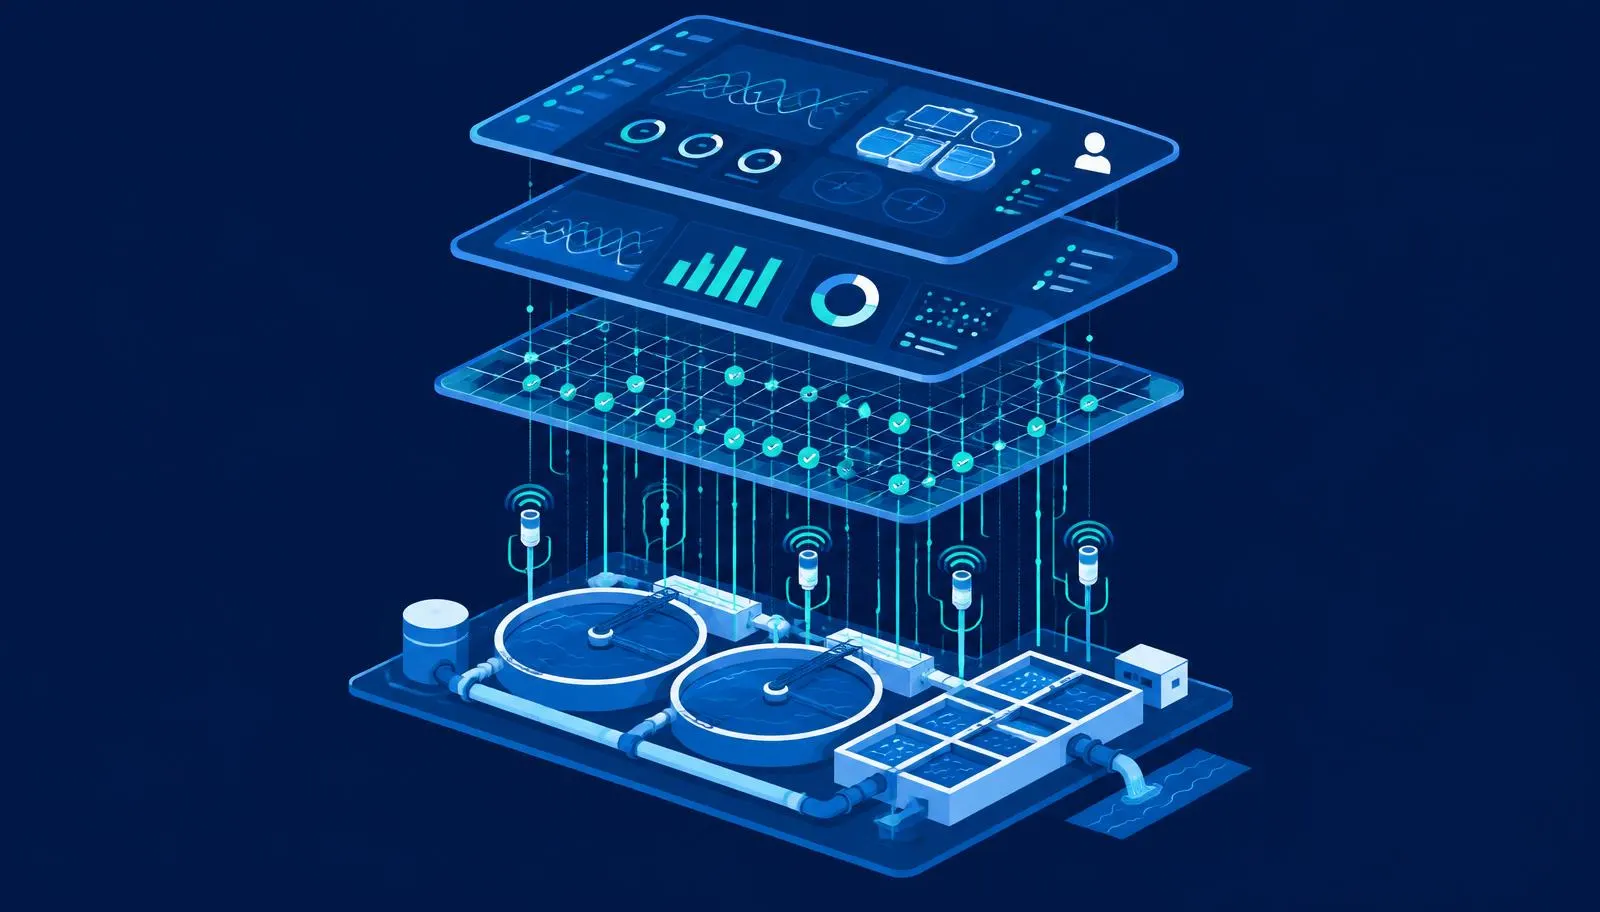
Seven layers from data to evidence.
- L1
Sample / future plant data
- L2
Schema & unit mapping
- L3
Data quality checks
- L4
Forecasting / risk layer
- L5
Explanation & confidence
- L6
Operator workflow
- L7
Evidence & reporting
B · Data layer
Sample data now. Plant-specific data for validation.
Current
A deterministic synthetic environment with 14 signals at 15-minute intervals and four scenarios — not collected from an operating plant.
Required for validation
Plant-specific historical data, lab-confirmed samples and documented operating context, assessed in a data-readiness review.
C · Forecasting architecture
Synthetic-trained model today; plant benchmarking next.
The current ridge model is trained and tested only on the deterministic simulator. Candidate models will be compared again on plant data at each horizon before any production claim.
- Persistence
- ElasticNet
- XGBoost / LightGBM
- LSTM / GRU
- TCN
- Transformer / TFT
- Probabilistic approaches
D · Explainability & uncertainty
Working on the synthetic model; plant validation remains.
Current demonstration
Exact linear SHAP explains the synthetic-trained ridge model. Demonstration bands use residuals from a synthetic holdout set; neither is evidence of plant performance or physical causation.
Required before production
The model, explanations and uncertainty must be benchmarked and validated on plant data before operational use.
E · AI and rules
How AI is used
- Numerical forecasts
- Ridge regression uses synthetic time-series inputs to predict NH₄-N. A language model does not produce these numbers. +1h, +2h and +4h are forecast horizons; they are not a guaranteed warning lead time.
- Evidence Copilot
- Bounded retrieval uses the saved case, verified product sources or approved references. An optional language model can draft a response. Each answer shows its actual method and sources.
- Reports
- Reports use deterministic saved facts and screening classifications. Optional AI can only order evidence gaps. A person reviews and approves the draft.
- Quality, screening and simulation
- Data-quality checks and screening use explicit rules. What-if and control use simulation equations and rules. These functions do not use generative AI or operate plant equipment.
- Approved corpus only
- Source cards on every answer
- Evidence status & coverage
- Insufficient-evidence response
- Read-only — no actions
Release guide
Product questions
Is this final software or a demonstration?
This private release demonstrates a complete operator investigation workflow using synthetic data and saved observations. It includes data-quality checks, rule-based screening, operator review, evidence answers and reports. Synthetic-trained forecasting, model attribution and simulated controls are experimental. Site-specific validation and industrial integration are separate steps. The demonstration cannot control physical equipment.
Source: Demonstration scope and read-only boundary · WWC product facts v1
Where did the numerical model’s training data come from?
The Ridge model was trained only on time series from the deterministic synthetic plant generator. The targets were future simulated ammonium nitrogen (NH₄-N) values. This model did not use real-plant or university data. Earlier project experiments are a separate historical record; they are not this released model’s training source.
Source: Ridge forecast training provenance · WWC product facts v1
Which AI is used for forecasts, Copilot and reports?
The NH₄-N numerical forecasts use Ridge regression trained on synthetic time-series data. Evidence Copilot retrieves bounded product or case evidence, and may use a language model to draft a sourced answer. The method shown on each answer identifies what actually ran. Reports use saved readings, deterministic classification and recorded human actions; optional AI only orders applicable evidence gaps, and a person reviews the draft. Data quality, screening and simulation use explicit rules or equations.
Source: Forecasting, Copilot and report methods · WWC product facts v1
Does entering new data retrain or validate the model?
Saving an observation records its values and origins for the case. It does not verify the measurement, create time-series history, or train or validate the forecast model. Reference documents used by Copilot do not become training data. More data alone does not guarantee better accuracy.
Source: Observation and model evidence provenance · WWC product facts v1
Can we import files or connect to our plant immediately?
The demo has a synthetic stream, manual observations and saved cases, plus data and report exports. CSV export is available; CSV import is not part of this release. The internal application API does not connect to a plant. A read-only external plant API, SCADA or LIMS connection requires site-specific technical scoping.
Source: Data input, export and integration boundaries · WWC product facts v1
Does a 99% health value mean 99% accuracy or removal efficiency?
No. When shown for the simulated data-health index, 99% is a generated scenario value. A synthetic scenario indicator used in this demonstration. It is not measured sensor accuracy, calibration certification, treatment efficiency, model accuracy or water-safety status. The separate Coverage check measures how many expected readings are present; it does not measure physical sensor health.
Source: Simulated data-health index and separate coverage check · WWC product facts v1
Is this model validated for textile or dyeing facilities?
The current model has a synthetic benchmark only. There is no evidenced real-plant validation, including for textile or dyeing facilities. A site evaluation needs authorized historical data, process context, verified measurement locations, units and timestamps, a defined target and a validation plan before any operational use.
Source: Synthetic validation scope and site readiness · WWC product facts v1
Who decides where sensors should be installed?
Sampling point identifies where an observation was recorded. Selecting it does not prescribe sensor installation or certify a measurement. The facility and its qualified process or instrumentation team determine locations based on the site. The demo does not recommend a physical sensor location.
Source: Sampling-point and sensor placement boundaries · WWC product facts v1
How is access to the private demo controlled?
The private demonstration requires an invite and a server-validated session. The current release does not include a self-service client admin or user-management console.
Source: Private demo access scope · WWC product facts v1
Does a four-hour forecast guarantee a four-hour warning?
No. +1h, +2h and +4h are forecast horizons; they are not a guaranteed warning lead time. The current NH₄-N forecast is an experimental synthetic-trained benchmark, with no evidenced warning lead time at a real plant.
Source: NH₄-N forecast horizons and limits · WWC product facts v1
F · Security & control boundary
Read-only by design.
- No PLC writes
- No chemical dosing
- No blower actuation
- No control-system commands
G · Product truth matrix
What exists, and what each capability depends on next.
| Capability | MVP frontend | Data / model status | Next dependency |
|---|---|---|---|
| Plant & Data Workspace | Complete | Curated Demo OutputSynthetic browser stream and demo-backend cases | Plant data onboarding |
| Data Quality | Complete | Deterministic checks over saved case data | Thresholds tuned per plant |
| Model Forecast | Complete | Curated Demo OutputNH₄-N forecasts at +1, +2 and +4 hours from a ridge model trained on the synthetic simulation | Benchmark on plant data |
| Saved-case Risk Preview | Complete | Curated Demo OutputRule-based screening of stored case data | Plant-specific operating rules |
| Demonstration intervals | Complete | Curated Demo OutputSynthetic holdout residual bands | Calibrated production uncertainty |
| Driver Analysis | Complete | Curated Demo OutputExact linear SHAP for the synthetic-trained ridge model | Attribution for a plant-validated model |
| Alert + Action Workflow | Complete | Demo-backend persistence and human review | Organization accounts and authorization |
| Evidence Copilot | Complete | Experimental AI POCBounded retrieval; method shown for LLM or fallback answers | Plant-approved evidence corpus |
| AI Report Drafting | Complete | Experimental AI POCDeterministic evidence and screening, optional AI ordering of evidence gaps, and human approval | Production review and governance |
| Digital Twin / What-if | Complete | Curated Demo OutputDeterministic simulation; no physical plant actuation | Plant-calibrated hybrid twin |
| Control Center | Complete | Curated Demo OutputSimulation-only recommendations and controls | Validated read-only advisory pilot |
| Guided plant setup | Partial | Curated Demo OutputFixed synthetic plant and case forms | Configurable plant onboarding requires scope approval |
| NO₃-N forecast preview | Deferred | Future RoadmapNitrate is displayed as a reading. Forecasts cover NH₄-N. | Confirm scope and model evidence |
| Algorithm benchmark lab | Deferred | Future RoadmapTechnology roadmap and synthetic model card | Confirm scope for an interactive lab |
| Live SCADA / Historian | — | Not IncludedNo physical plant connection | Read-only integration phase |
| Calibrated conformal intervals | — | Not IncludedNot implemented | Requires a plant-validated model |
| Production prediction engine | — | In DevelopmentNot plant validated | Benchmark and pilot |
| Autonomous control | — | Not IncludedNo command path to plant equipment | Out of scope |
H · Roadmap
Six phases, in order.
PHASE 1 · CURRENT
Interactive MVP frontend
Complete operator workflow on synthetic sample data.
PHASE 2
Real-data readiness & benchmark
Plant data assessment and benchmark against simple baselines.
PHASE 3
Predictive pilot
Offline forecasting evaluation on plant-specific history.
PHASE 4
Shadow-mode operator pilot
Forecasts shown alongside operations without influencing control.
PHASE 5
Read-only integration
Read-only historian/SCADA ingestion with security review.
PHASE 6
Future hybrid intelligence
Mechanistic + ML, digital shadow, constrained what-if analysis.
Future Roadmap